Simplify data access
With an intuitive, no-code approach, professionals can focus on uncovering insights instead of wrestling with complex data retrieval processes. Ask questions in plain language and get answers back in seconds, not days.
Get answers from trackers and tables for richer insights without Structure Query Language (SQL) expertise

Siloed information
Remove the struggle to connect data sources.
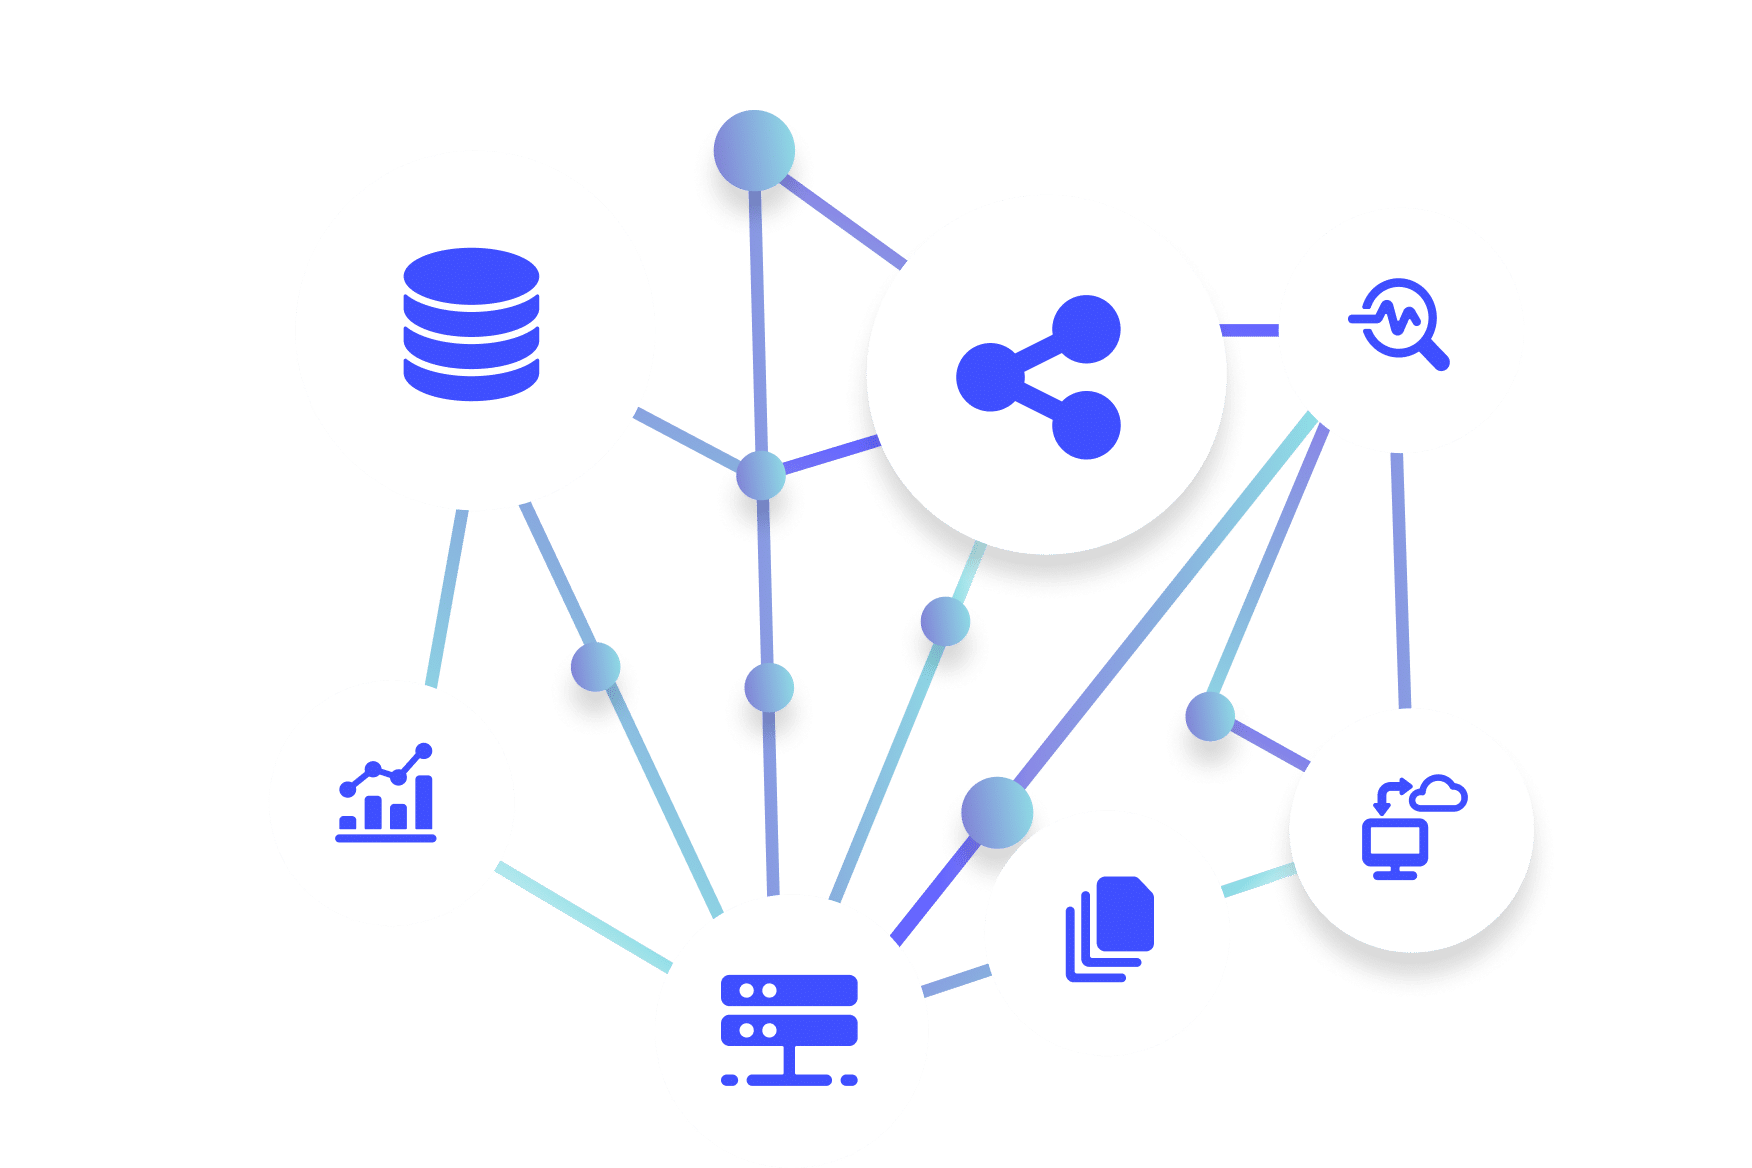
DeepSights brings all insights into one place.
Complex queries
Eliminate dependency on expert analyst support for SQL queries.
Ask questions in plain English with DeepSights.
Slow decision-making
Overcome delay in reacting to market moves.
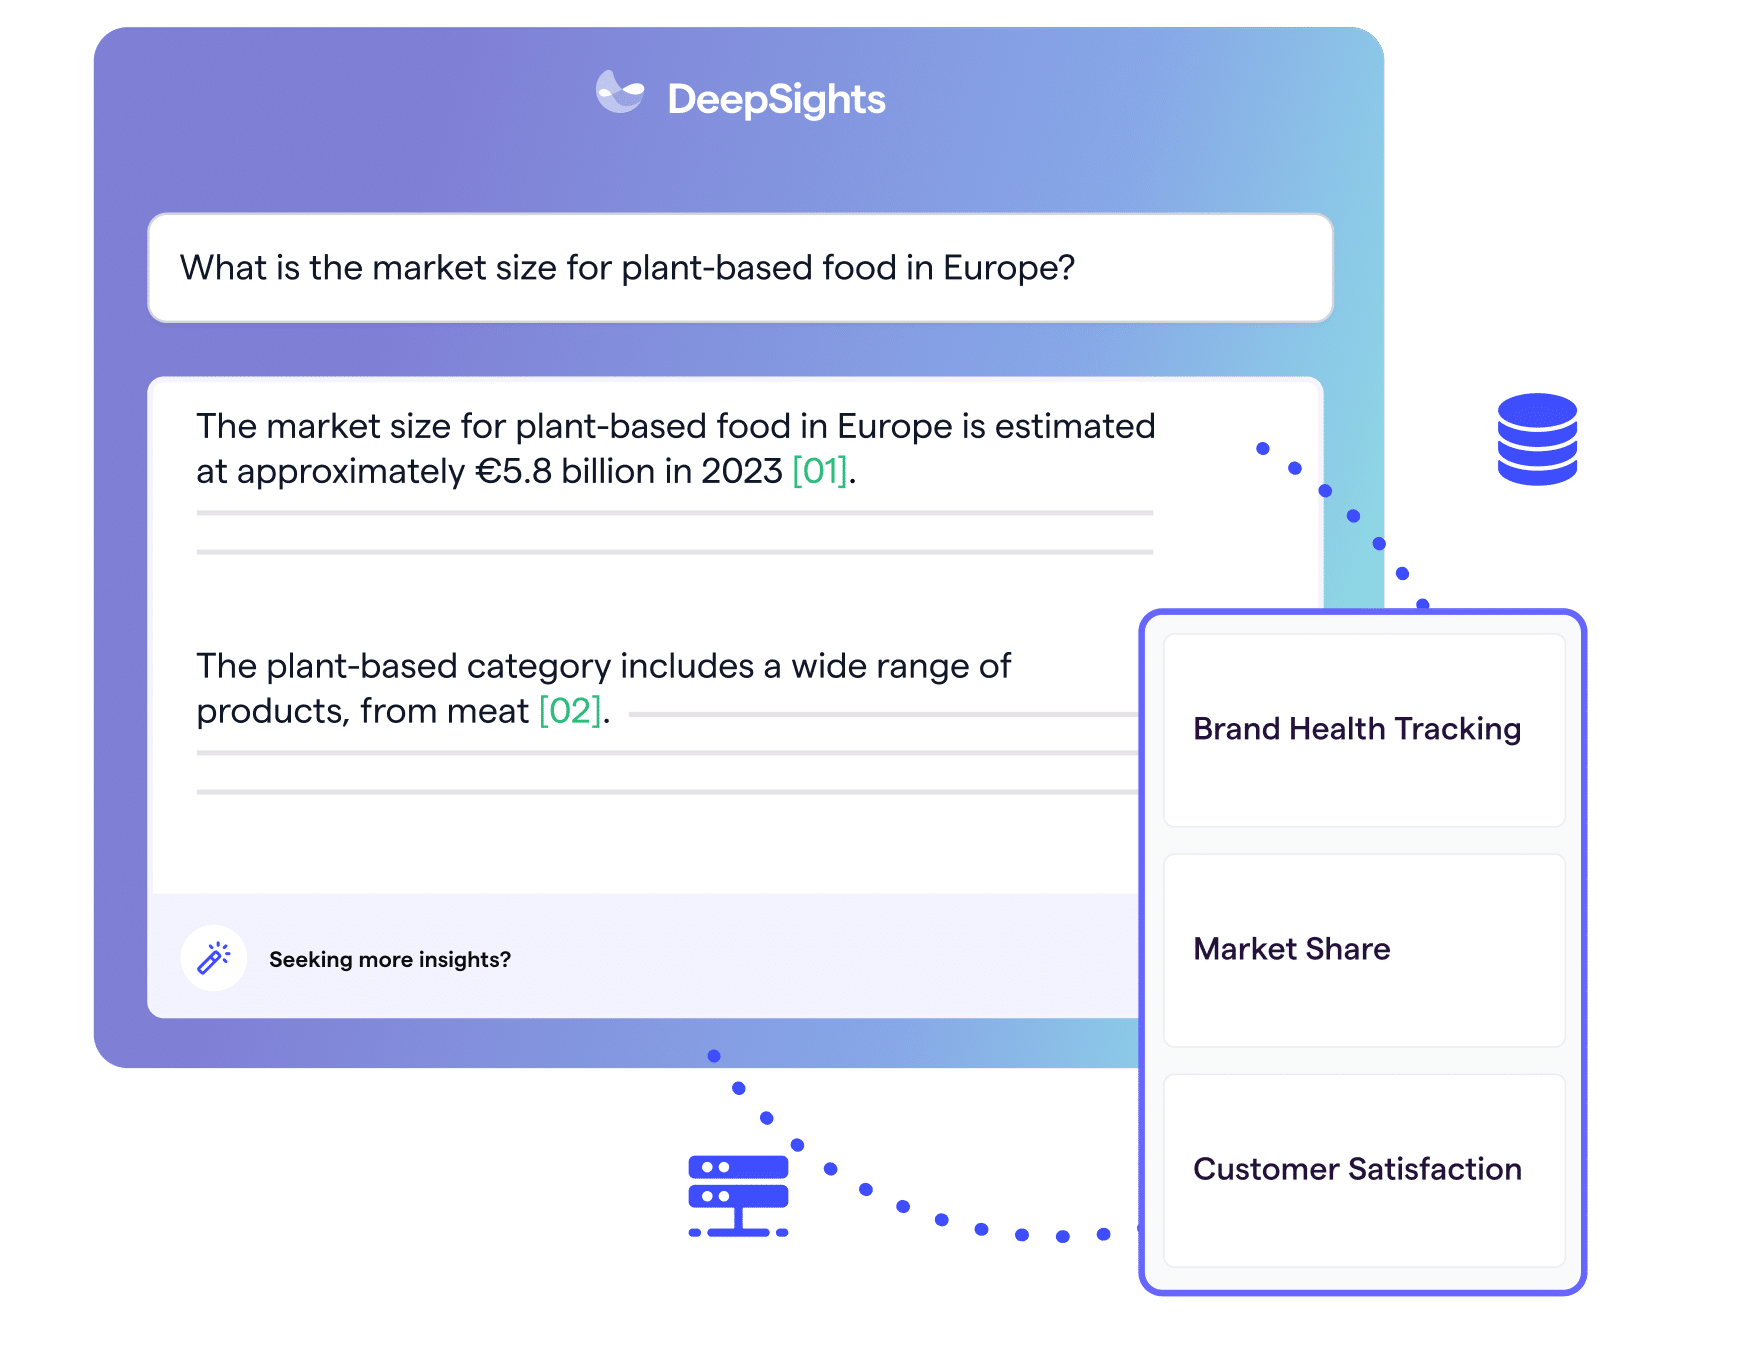
Get instant answers from brand health trackers, sales data, and panel monitors with DeepSights.
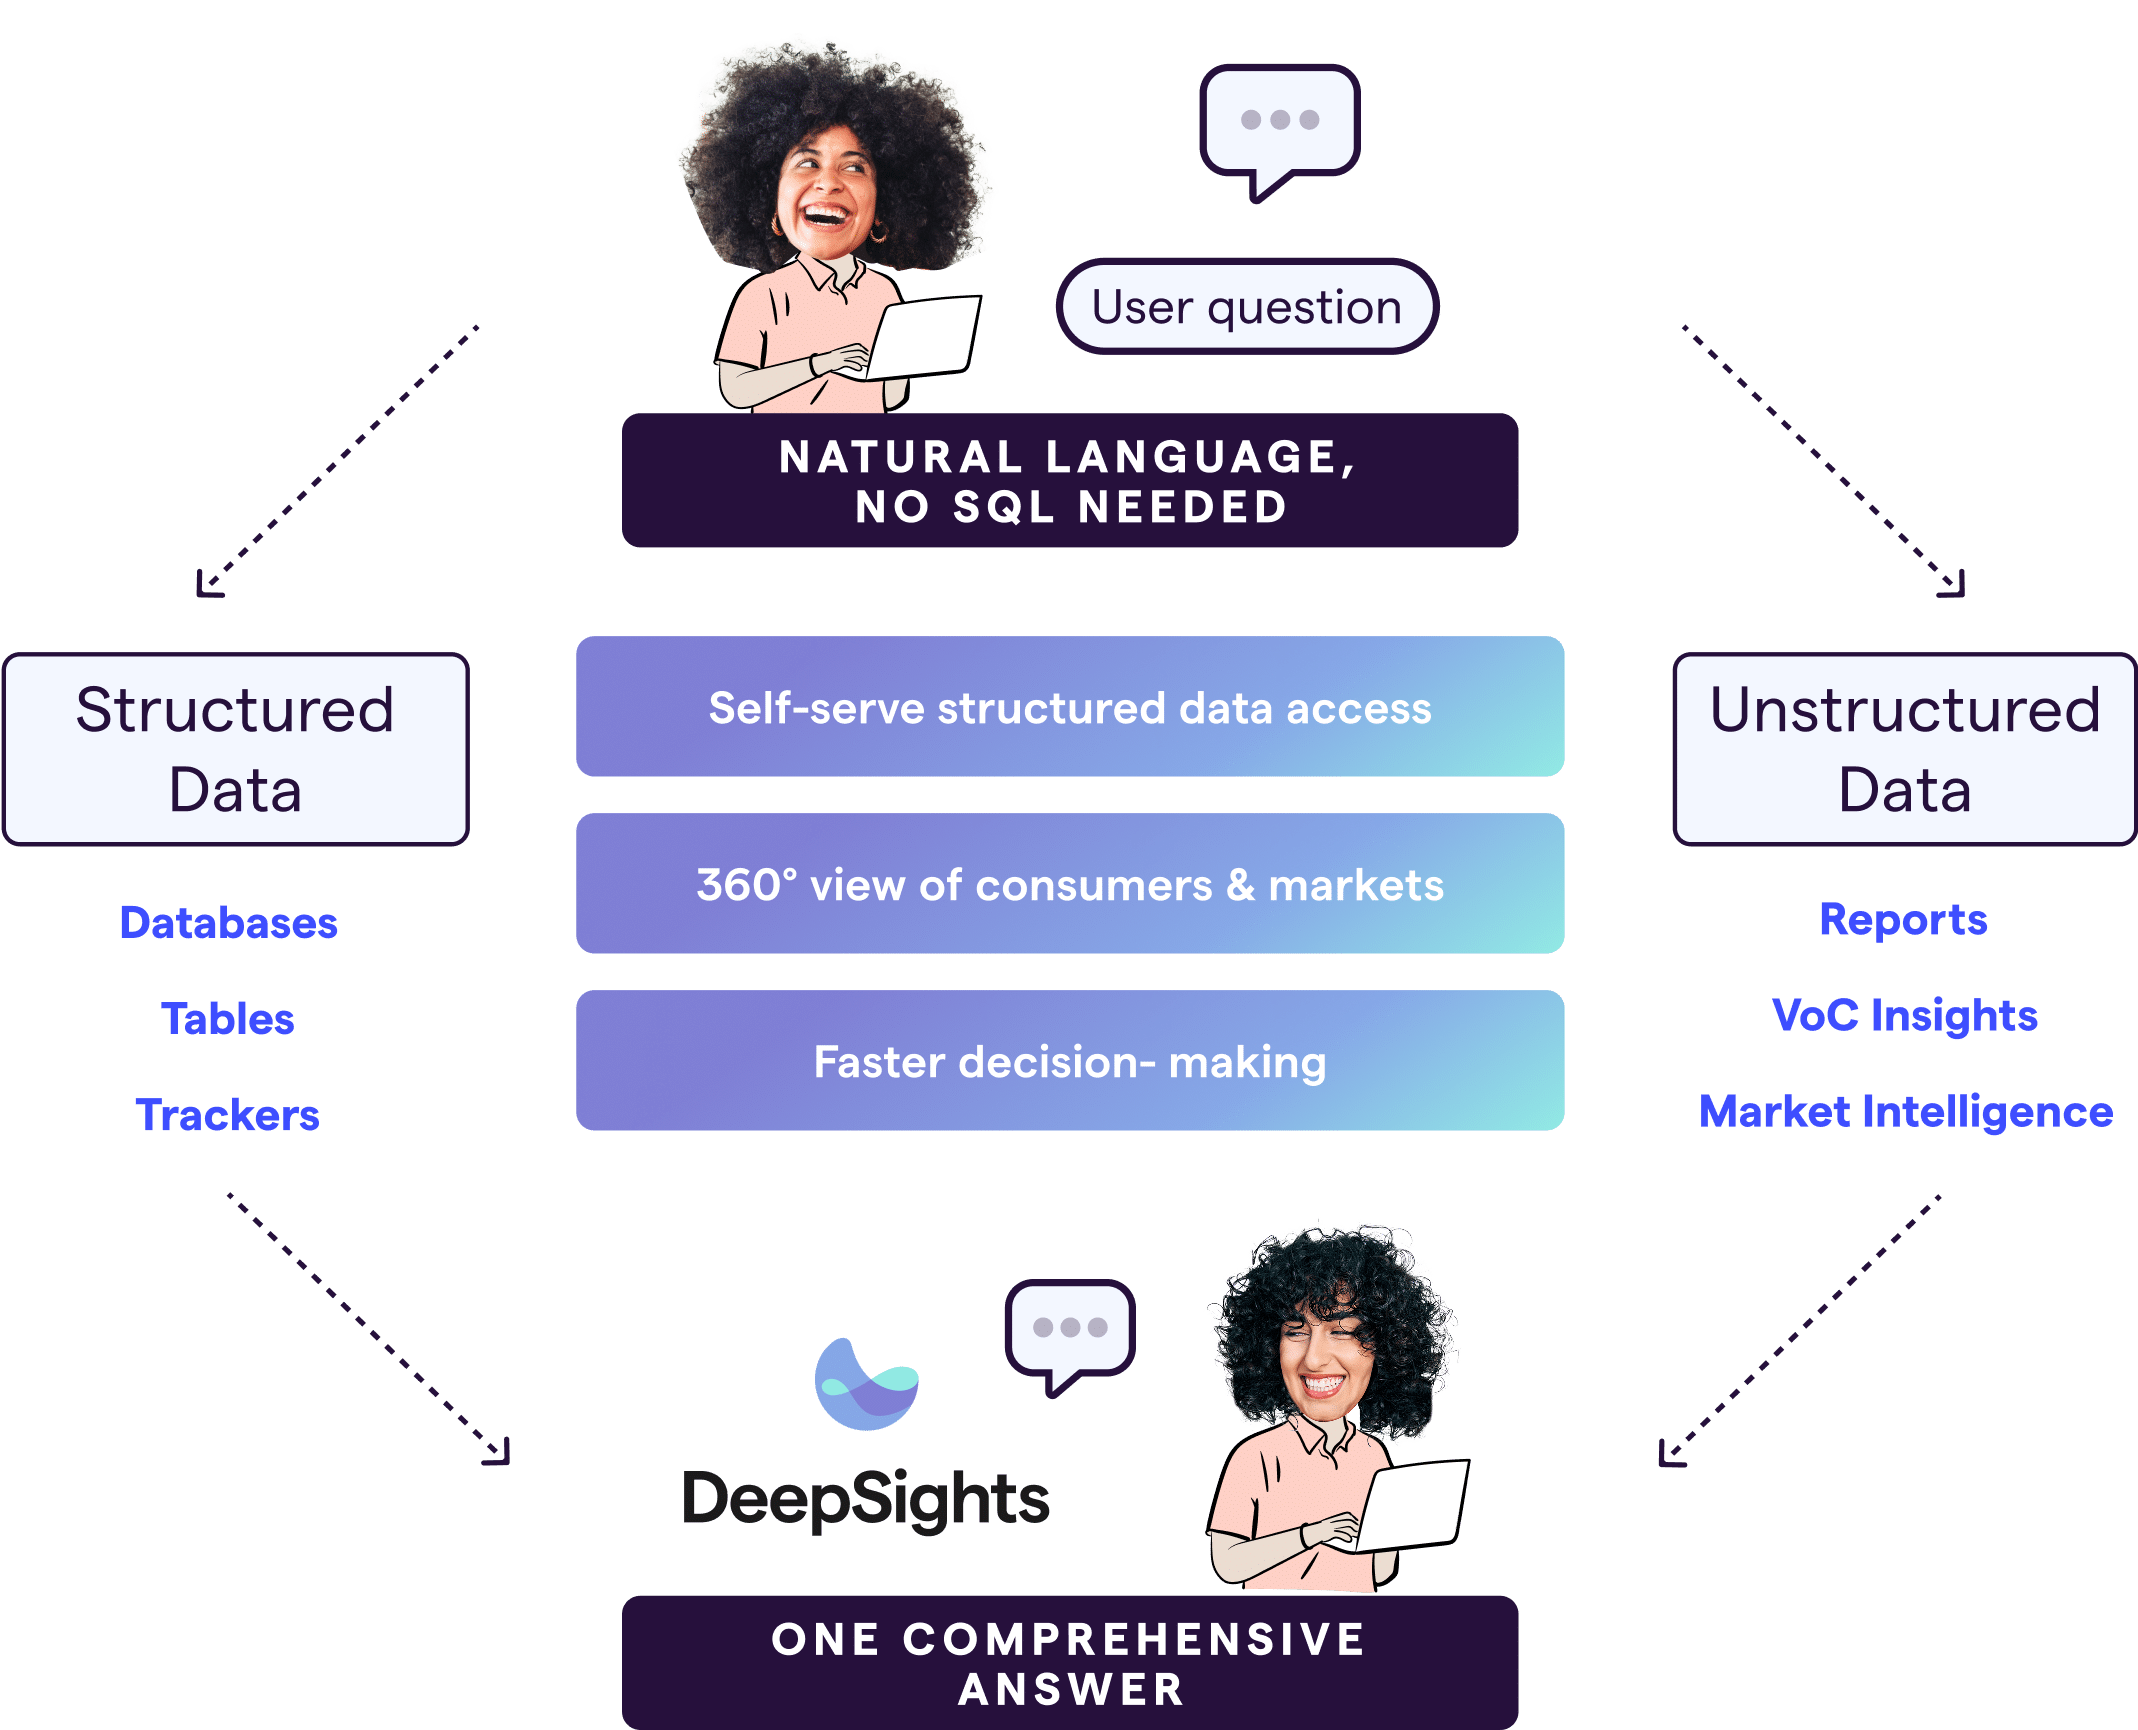
Your data holds the answers—but getting to them shouldn’t require SQL expertise, multiple tools, or waiting on analysts. DeepSights makes insights instantly accessible by integrating structured data from in-house data lakes and databases—all in plain language.


With an intuitive, no-code approach, professionals can focus on uncovering insights instead of wrestling with complex data retrieval processes. Ask questions in plain language and get answers back in seconds, not days.
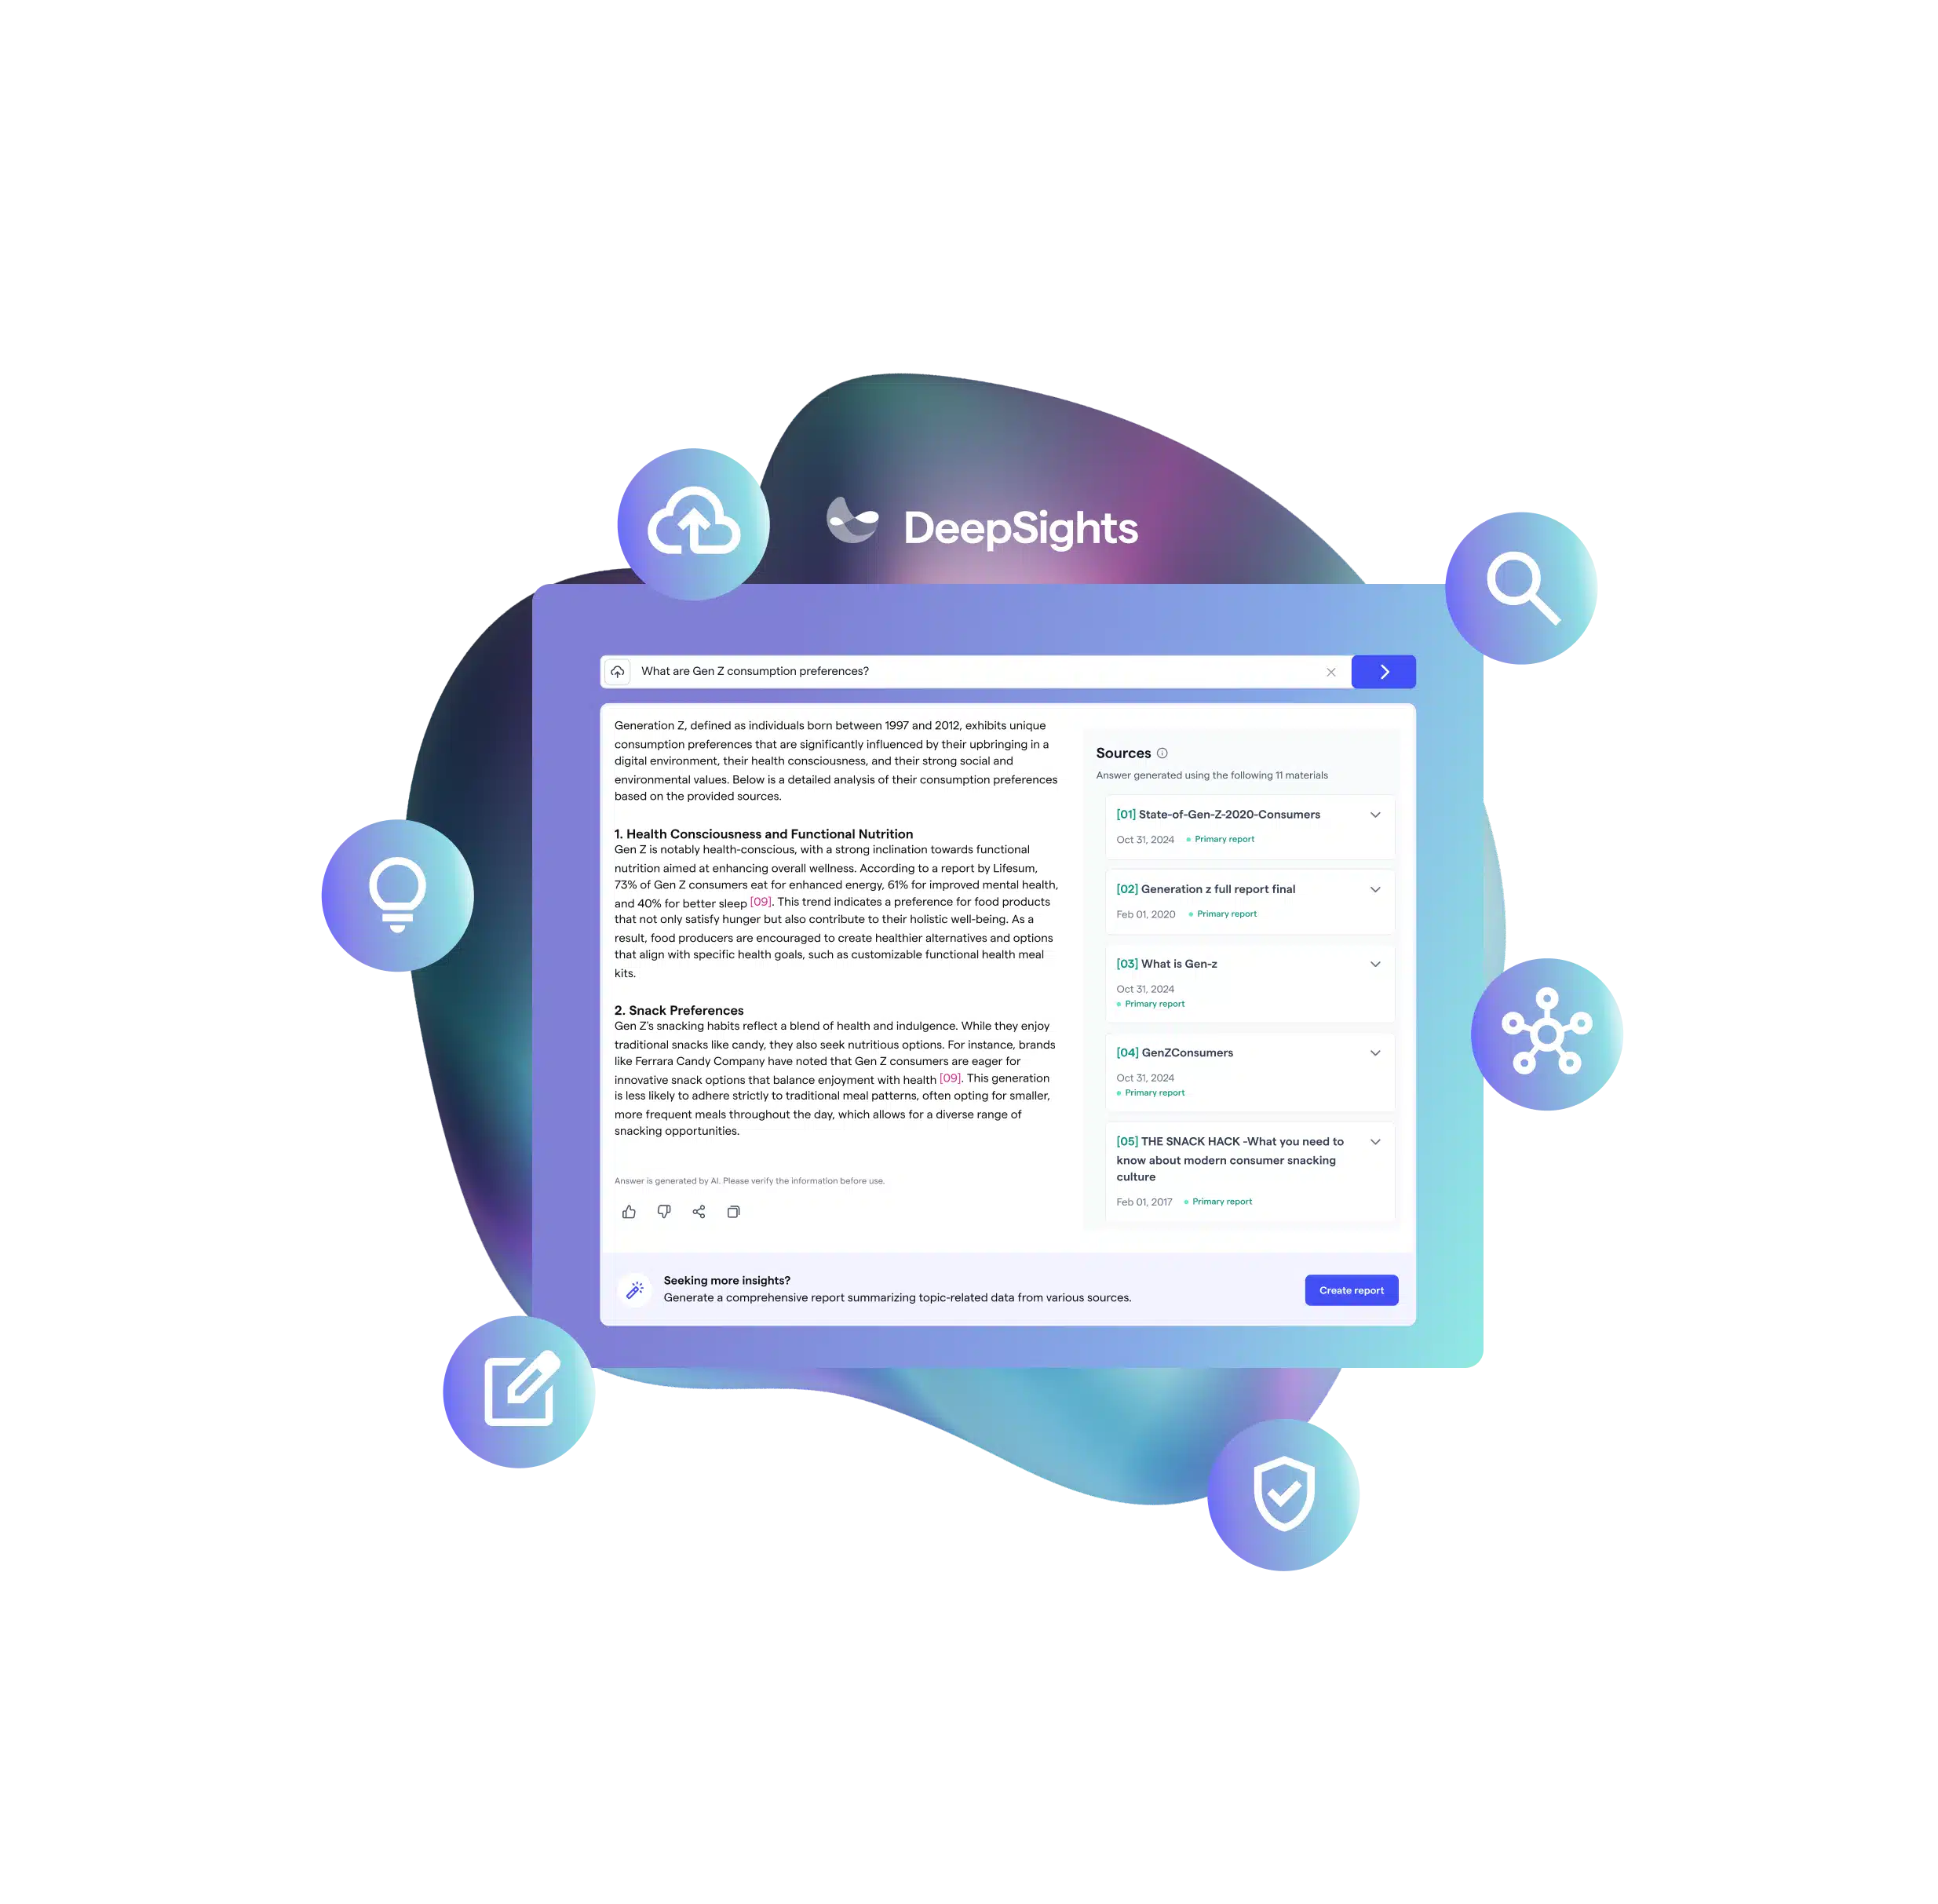
Evidence-backed insights with full traceability through data citations and verification of SQL queries, so you can act on insights you trust. Get a 360° market view by combining data from dashboards and databases with unstructured content like text and visuals found in reports and transcripts.

Get insights that are buried in disparate data applications without acquiring new coding skills or waiting on other teams to prioritize your work. Seamlessly access all relevant data from one place, making it easier to uncover relationships across sources.
Self-serve answers from trackers and data tables by performing required data analysis within each table.

Measure average customer satisfaction scores by region. Compare total sales volume across product categories.
Spot emerging shopping trends across different demographics. Measure sales lift before, during, and after a major ad campaign.
Understand income distribution among target shoppers. See how price sensitivity varies across customer segments.
Link ad spend to purchase conversions across channels. Correlate product features with customer satisfaction scores.